 In the first part of this series on Data Analysis tools, we looked at 13 tools/techniques and the processes they are used in.
This series is part of the bigger series on ITTO groups, all 6 of them covering 49 tools and techniques.
In the first post of this series, we looked at the Data Gathering Techniques used across all the processes required for the PMP exam.
Why this series?
ITTOs are one of the most stressful parts of studying for a PMP student.
When you study a tool and technique in the context of a process, you would be doing that over and over again in each of the processes that it is part of.
This is not a bad way to study, it’s just that sometimes with a bunch of tools and techniques to study under a process, it can feel quite overwhelming.
The other way to study is to understand various techniques that are similar in nature (remember we said there are 6 groups?) and being in the same context study them all together.
And armed with this knowledge when you study a process and you come across one of these techniques you will feel comfortable because it is familiar and you already know what it does, and how it works.
This makes the whole PMP exam study much.. much easier.
Get a cup of your favorite brew, and let’s begin. Or continue, if you are coming from the first part. 😃
In this post, we will look at these important Data Analysis techniques –
- Proposal evaluation
- Regression analysis
- Reserve analysis
- Risk data quality assessment
- Risk probability and impact assessment
- Root cause analysis
- Sensitivity analysis
- Simulation
- Stakeholder analysis
- SWOT analysis
- Technical performance analysis
- Trend analysis
- Variance analysis
- What-if scenario analysis
Do you want my PMP launch course ($27 value, free today)?
Data Analysis #14: Proposal evaluation
Based on the make-or-buy decision,
following the procurement strategy of the organization,
the buyer creates the procurement statement of work, a bid document such as a Request For Proposal, Request for Information, Request for Quote, and any other supporting documents.
Next, the buyer advertises the bid and solicits proposals from prospective sellers.
Once the proposals are received from these prospective sellers, the buyer will evaluate them to ensure that they are complete and in accordance with the technical, performance, pricing, and other criteria mentioned in the bid documents.
The process that uses the Proposal evaluation technique is –
Data Analysis #15: Regression analysis
By PMI’s definition, regression analysis is “an analytical technique where a series of input variables are examined in relation to their corresponding output results in order to develop a mathematical or statistical relationship.”
In simpler terms, this technique involves understanding the interrelationship of input variables of the project to the project outcome.
For example, in an agricultural project of optimizing the yield of a crop, the combination of fertilizers and water is studied in relation to the crop yield. This data is then further used in similar or future projects.
This is why regression analysis is helpful whenever you close a project or a phase.
The process that uses the Regression analysis technique is –
Data Analysis #16: Reserve analysis
Every project needs good estimates of schedule and cost. However, things can and will go against the plan and when that happens you will need more time or budget.
Sometimes, this happens due to identified risks materializing, and sometimes due to factors outside of the project’s control – such as natural disasters or changes in the political climate.
In other words, you can say ‘things will go wrong due to uncertainty‘. That’s an important word.
For such eventualities, you must have some reserves – that is, schedule duration, budget, estimated cost, or funds for a project
And that needs certain analysis to arrive at the best quantity you can provide.
Now, for the additional costs incurred due to the materialization of identified risks, you will have contingency reserves. This is part of the cost baseline itself.
The processes that use Reserve analysis are –
Data Analysis #17: Risk data quality assessment
In the risk management knowledge area, we know that we do qualitative risk analysis and quantitative risk analysis.
The former is a rather subjective analysis, and the latter is based on numbers and calculations. When subjectivity is involved, there is a certain amount of inherent risk. My ‘best’ could be your ‘better’ and someone else’s ‘good’, right?
That’s why the quality of risk data needs to be analyzed. When the input is of good quality, the output can be expected to be certain.
The risk data is analyzed for accuracy and reliability.
The process that uses Risk data quality assessment is –
Data Analysis #18: Risk probability and impact assessment
Probability refers to the likelihood of an event. In this case, the risk materialization.
And when a risk does materialize, we also need to see what impact it could have on our project objectives such as cost, schedule, quality and so on.
This has to be done for every risk that is identified. And for this analysis, you can involve anyone that you think can help do a good job. It could be an expert from another project or a consultant.
Talk about the benefits of good networking for a project manager!
Here’s an interesting twist.
PMI categorizes risks as negative and positive risks, as you know. Negative risks are called threats, and positive risks and called opportunities.
The impact of a threat is negative, and the impact of an opportunity is positive.
But wait, there has to be some yardstick to measure these, right? Or do we pull it out of thin air?
No, we don’t. 😃
The Definition of Probability and Impact – on both schedule and cost – is usually decided at the project level, most likely based on organizational-level figures
Here’s an example:

Figure: Impact Probability Matrix definition, courtesy industrialaudit.com
The process that uses Risk probability and impact assessment is –
Data Analysis #19: Root cause analysis
When things go wrong, every project manager knows that she should ensure it does not happen again. For which, the cause of the event needs to be identified.
The root cause, that is.
One cause can create multiple risks, defects, or variances (in the purview of a process).
The processes that use the Root cause analysis technique are –
- Monitor and Control Project Work
- Manage Quality
- Control Quality
- Identify Risks
- Plan Stakeholder Engagement
- Monitor Stakeholder Engagement
Data Analysis #20: Sensitivity analysis
This is an analysis done to identify which risks have the most potential impact on the project outcomes if materialized.
For example, look at this Tornado diagram.
 Figure: Tornado diagram. (2020, January 10). In Wikipedia.
The profitability of a game being played at a stadium is being analyzed. The individual components are the average ticket price, the total number of tickets sold (both of which give you revenue), and cost.
The variables are listed in the decreasing order of variability on the outcome, so you can focus on the top ones that have a larger impact.
The process that uses Sensitivity analysis is –
Data Analysis #21: Simulation
When there are too many variables involved in a project, each of which is impacting the outcome, manual analysis is pretty much ruled out.
The potential combination of values of these variables can be huge.
This is where the simulation is helpful.
Simulations create a model of the overall effect of individual project risks as well as any other sources of uncertainty, to understand their potential impact on project objectives.
The most common technique is Monte Carlo analysis, in which risks are used to calculate the possible schedule outcome of the project.
As an example, from a Monte Carlo analysis, you can say ‘there is a 10% probability that the project will complete on or before the target date, while a 90% probability of completing the project by a certain later date’, whatever date the model gives you.
The process that uses the Simulation technique is –
Data Analysis #22: Stakeholder analysis
Who is a stakeholder again?
Anyone that can impact or be impacted by the execution or outcome of a project, directly or indirectly.
That can be a huge group, of course. And it includes people that want the project to succeed, and those that do not.
That’s why analyzing them and even grouping and categorizing them becomes essential, so their expectations can be managed.
Here’s one way to analyze stakeholders –
- Identify all stakeholders in the project
- Understand their individual needs and interests
- Group them according to their levels of interest and participation
- Assess their potential positive or negative impact on the project’s objectives
- Understand each one of their definition of project success
- Identify any concerns they may have about the project
- Figure how their actions may affect project outcome
The processes that use Stakeholder analysis are –
Data Analysis #23: SWOT analysis
Every person, team, or organization has some strengths and weaknesses. And in the environment in which they operate exist few opportunities and threats – classified based on those strengths and weaknesses.
The techniques to identify these for a project help maximize opportunities and minimize threats.
When you do a SWOT analysis for a project, you will do it from the perspective of managing risks – both positive and negative.
That is, you analyze how you can use the strengths of the project to identify opportunities and make them materialize, and also identify any threats emanating from the project’s weaknesses.
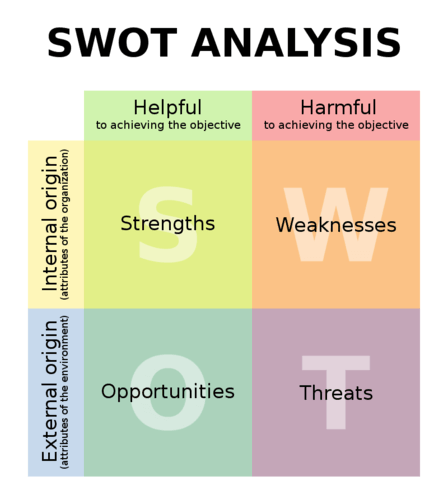 SWOT Analysis (courtesy: By Xhienne – CC BY-SA 2.5)
There is one other thing you will analyze.
Sometimes, your project’s weaknesses might be negated by the strengths of the organization.
For instance, if your project’s weakness is hiring niche-skill-oriented people, but your company’s core competency is to hire niche-skill people – then your project’s weakness is no more weakness.
So you always do the SWOT analysis of your project in the purview of the results of the SWOT analysis of your organization.
The processes that use SWOT analysis are –
Data Analysis #24: Technical performance analysis
The thing about performance analysis is that it is always the comparison of actual with the planned.
This technique compares the planned technical capabilities for a given cost & schedule with the actual one
In order to do this analysis, the objective, measurement criteria, comparison criteria, and the understanding of what is expected and what is not – all have to be laid out in detail ahead of time.
Now when there are deviations from the expected results, you will look at the impact of that on the threats and opportunities.
The process that uses Technical performance analysis is –
Data Analysis #25: Trend analysis
Trend analysis forecasts the future behavior of an entity based on past behavior. And you make use of mathematical models for this analysis.
If the market for your product is growing for the past several quarters, considering several factors, of course, the trend may indicate the continuation in the present quarter as well, for instance.
Based on the trend analysis, you can plan any potential preventive actions proactively.
The processes that use Trend analysis are –
- Monitor and Control Project Work
- Close Project or Phase
- Control Scope
- Control Schedule
- Control Costs
- Control Resources
- Control Procurements
Data Analysis #26: Variance analysis
Like Trend analysis, Variance analysis also depends on the mathematical models. They forecast any potential variance between the expected performance and actual performance in the future, based on past data.
If your IT software project has been producing a certain number of defects in the past few releases, again the mathematical models will do the complex calculations based on various factors, and tell you if you are expected to find more defects or lesser.
Based on the outcome of this analysis you will analyze the impact on cost and schedule and decide whether any corrective or preventive actions will be required.
The processes that use Variance analysis are –
- Monitor and Control Project Work
- Close Project or Phase
- Control Scope
- Control Schedule
- Control Costs
Data Analysis #27: What-if scenario analysis
“What if this happens?” and “what if that happens?”
Every event can have potentially several outcomes, and you will need to analyze each of those outcomes for any impact on project constraints, and/or risks in the project.
Just like a game of chess. You will have to guess the potential next moves of the opponent and plan your moves accordingly.
- What if the vendor does not provide raw materials within time?>
- What if the release does not go to the end users by the next delivery date?
- What if the funding for the project does not come through before the next phase?
As a project manager, you will be constantly doing what-if analysis to ensure the project goes well and the project objectives are met.
The processes that use What-if scenario analysis are –
Summary
Wow, too many tools and techniques, but essential ones at that. The good news is that you don’t need to remember each of them on their own.
Simply focus on understanding each of these, and when you revisit them in the context of the process that they are used in, you will see that the pieces of the puzzle fall into place.
Your knowledge about the processes will grow and you will be better prepared for ITTO-based questions on the exam.
In a logical sense, we first gather data, analyze them in a specific context, and represent the data in order to get some insights or see trends.
With this now the upcoming post would be about Data Representation tools and techniques.
Happy studying!
(Follow me on LinkedIn and click the 🔔 icon on the profile for the daily content that helps you attract unlimited growth opportunities as a manager.)